PiCK
Bitcoin Futures Leverage Jumps 4%, Raising Fears of Repeat of Last October’s Liquidation Rout
Summary
- Bitcoin futures leverage and open interest climbed to levels close to those seen just before last October’s liquidation rout, raising concern that volatility could increase again.
- Current funding rates are lower than they were last year, and liquidation intensity during price declines is running at about one-ninth of the earlier episode, suggesting the risk of overheating and a large cascade of forced liquidations remains limited.
- The U.S. FOMC, Bitcoin’s $82,300 support level, and spot ETF inflows will be the key factors shaping whether Bitcoin falls further or stages a rebound.
Forecast Trend Report by Period



Rapidly rising leverage in the Bitcoin futures market is stoking concern that last year’s “October liquidation rout” could be repeated. Still, some analysts say the market is less overheated than it was then, limiting the risk of a broad chain of forced liquidations.
According to crypto data analytics firm CoinGlass, Bitcoin futures open interest rose 4.0% over the past seven days to 650,480 BTC as of Oct. 7. That is similar to the move before last year’s major liquidation event, when open interest climbed 4.1% over the five days leading up to Oct. 10.
Forced liquidations piled up as the crypto market tumbled that day. Bitcoin fell more than 2% to the $83,000 level, while Ether dropped 3.5% to around $2,600. Long positions took the brunt of the hit, with about $403.58 million liquidated in just one hour.
Traders are watching the resemblance between the recent leverage build-up and the pattern seen just before last October’s liquidation event. At the time, U.S. President Donald Trump announced additional tariffs on Chinese imports, sparking a sharp market selloff. CoinGlass data showed more than $19 billion in crypto positions were forcibly liquidated over the two days from Oct. 10 to Oct. 11 last year. About 90% of that total was in long positions, or roughly $17 billion.
Leverage relative to market size has also moved closer to those levels. Bitcoin open interest now stands at 3.2% of its market capitalization, approaching the 3.7% seen before Oct. 10 last year. Ether is at 10.4%, near the 11.3% recorded at the time.
Leverage Has Increased, but Overheating Appears Limited; Liquidation Intensity Is One-Ninth of Last Year
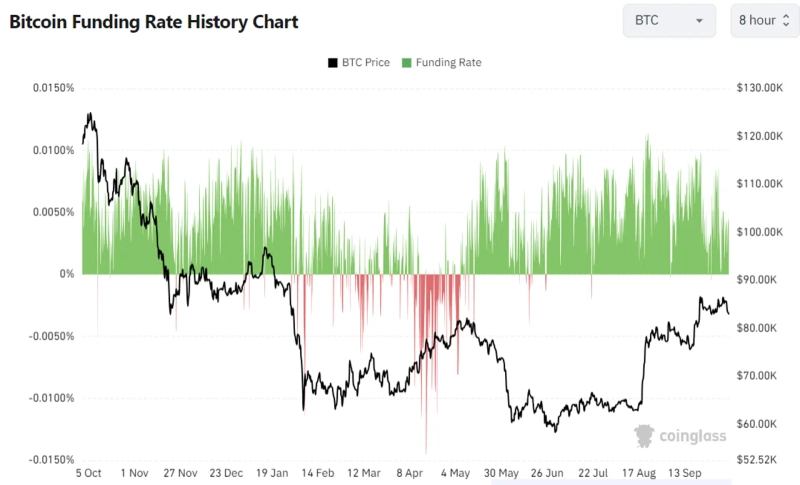
Still, some analysts say current market leverage differs from conditions seen in October last year. Ananda Banerjee, an on-chain analyst at BeInCrypto, said leverage is expanding again but there are no clear signs of the kind of overheating seen then. The reason, he said, is that the cost of holding positions has fallen sharply from a year earlier.
A key gauge of excessive leverage is the funding rate in the perpetual futures market. Funding is the fee exchanged between long and short traders. Persistently high positive funding rates are typically read as a sign that bullish long bets have become too crowded.
Before last October’s liquidation rout, Bitcoin and Ether funding rates on Binance and Bybit topped an annualized 8% on 18 of 32 exchange-day observations. Recently, only one of 28 observations rose above 8%, while three turned negative. Deribit showed a similar pattern. Bitcoin funding on the exchange, which had reached an annualized 26.9% before last year’s rout, has recently fallen to 7.1%. That means leverage has grown, but the cost of betting on further gains remains lower than it was then.
Another difference is the decline in derivative-linked stablecoin supply. CoinGecko data showed Ethena’s USDe supply has fallen 66% since last October to $4.99 billion. That suggests less capital is available for leverage-driven trades.
The intensity of liquidations during price declines is also lower than it was then. Over the past 24 hours, about $487.02 million in long positions were liquidated as Bitcoin fell roughly 2%. That works out to about $248 million in liquidations for every 1% drop in Bitcoin’s price. During last October’s liquidation rout, the figure was about $2.2 billion for every 1% decline, putting the current level at roughly one-ninth of that.
Bitcoin’s $82,300 Support in Focus; ETF Inflows Also Key
The next major variable for the market is the Federal Open Market Committee meeting scheduled for Oct. 27-28. Banerjee said another rate increase following September could push Treasury yields higher and drag Bitcoin down to $82,300. He added that the risk of a large chain of liquidations like last October remains low if funding rates stay below an annualized 8%.
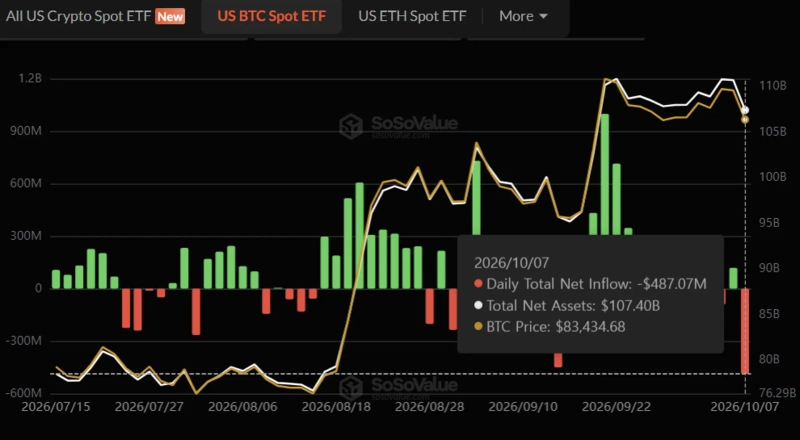
A recovery in institutional buying through U.S. spot exchange-traded funds will also be critical for any rebound. Omkar Godbole, an analyst at CoinDesk, said ETF inflows were the main driver behind Bitcoin’s rally in September. For Bitcoin to reclaim the $86,000 level and extend gains, institutional demand needs to return.
According to SoSoValue, U.S. spot Bitcoin ETFs recorded net inflows of $2.65 billion in September. But net inflows slowed to just $241 million last week. This week, flows weakened again, with net outflows reaching $487.07 million as of Oct. 7.
Oliver Carding, head of marketing at Tesseract Group, said current ETF buying has not recovered enough to offset macroeconomic pressure. Daily inflows of about $300 million or more over several trading sessions would be an important signal that institutional demand is returning.